umm what
Banned
can someone solve these two questiosn???
Attachments
-
 67.9 KB Views: 61
For question 2(A) i
When x>0 y=f(X)
When x<0 y=f(-x) thus original graph reflected about the y-axis
ii) Root fx, you only consider the two curved branches not the one in the middle, the root f(x) will just be beneath the original
iii) you reflect the result from (ii) about the x -axis
B)
i) i dont see how you have trouble with this?
rest is the same as question A, use the same methods
lolcan u draw a rough sketch for me plzzz
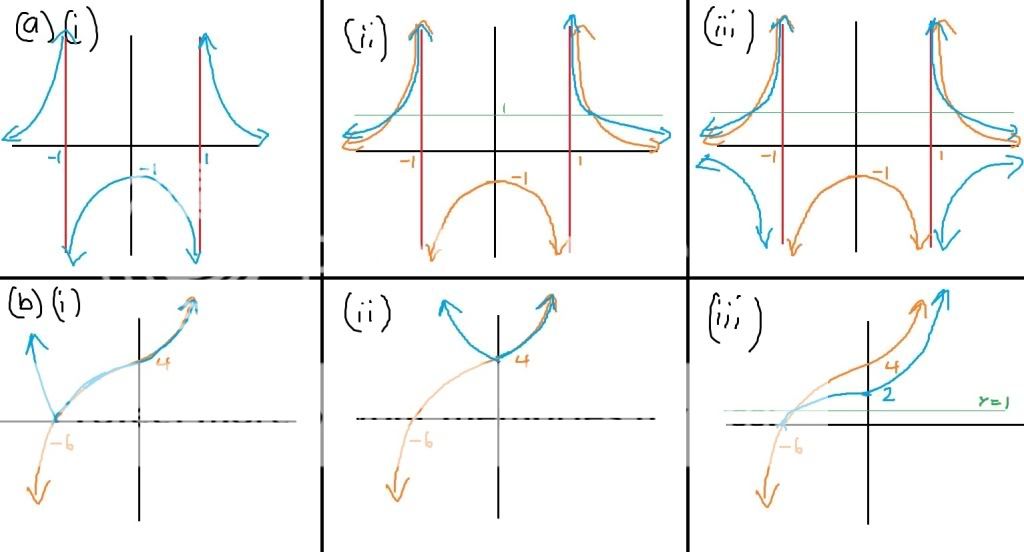
Remember that the sqrt(fx) graph shares a common point when y=1 (since square root of 1 is 1) and when y is between 0 and 1 (non inclusive), then the curve is actually higher. If I get 0.5 and I square root it, I get a larger number. Opposite when I go beyond y=1.heres root fx, for y squaredView attachment 24627 u basically rotate the coloured line about the x axis, the dotted line is the original graph
im drawing it on a laptop so yeh:L
") GOOD LUCK !
GOOD LUCK !yeh i thought so, i was doing it as i did for my test, since we have a y=1 asymptoteRemember that the sqrt(fx) graph shares a common point when y=1 (since square root of 1 is 1) and when y is between 0 and 1 (non inclusive), then the curve is actually higher. If I get 0.5 and I square root it, I get a larger number. Opposite when I go beyond y=1.
